Upleveling financial calculators
Role
UX designer — Redesign 13 types of financial calculators
Timeline
July – December 2023
Skills
Interaction design, UX strategy, Wireframing, Prototyping, Cross-functional communication
Team
1 PM, 1 UX Designer (Me), 1 UI Designer,
2 Engineers, 2 Clients at KB Bank
Context
KB Financial Group, one of Korea’s largest financial conglomerates, operates 12 subsidiaries, each with its own content platform—making it difficult for users to access financial tools in one place. To streamline this experience, KB launched “KB Think,” a centralized responsive website built on Adobe Experience Manager.
On this platform, I led the end-to-end redesign of the financial calculator, a tool commonly used for savings planning, mortgage calculations, and currency exchange.

Challenges in Entering Number and Understanding Results
Users experience friction throughout the calculation process.

How might we help users
1. Enter large numbers quickly and
2. Understand the key information
without being overwhelmed by raw data?
Research
Number entry
Hypothesis
3 out of 10 users struggled when entering large values
Error rates increased as numbers get longer

Internal user data showed that 3 out of 10 users struggled when entering large values, with error rates increasing as numbers became longer.
Based on this data, I formed the hypothesis that introducing number buttons could simplify number input and reduce errors. Also, This led to a key design question: should the buttons be arranged from large to small, or from small to large?
Test 1
16 out of 20 participants preferred 3 Buttons
Task completion time decreased by 65% using buttons

I tested button variations with two to five buttons. Through Observation of real usage scenarios and task completion time, 16 out of 20 participants preferred the 3 button layout. Also the task completion time decreased by 65% when using buttons compared to manual input.
Test 2
Participants entered numbers 30% faster with Option B

When observing the 20 participants using Option A and Option B, participants entered numbers 30% faster with Option B, where values increased from left to right.
Based on this insight, I adopted the small-to-large button order.
Calculation results
Hypothesis

Based on a user feedback, I explored two approaches to presenting the calculation results:
a raw data–first vs. an insight-first structure.
Test
Conducted qualitative interviews with 6 participants
4 out of 6 participants: “I prefer Option B and see the raw numbers only when I want.”

To validate the hypothesis, I conducted qualitative interviews with six participants to compare Option A and Option B.
4 participants preferred the insight-first structure, especially with a progressive disclosure approach—where raw data remains accessible but doesn’t overwhelm the initial view.
Solution
Scaling Across 13 Calculators
Beyond improving large-value entry and results presentation, I collaborated closely with a Product Manager and engineers to refine supporting modules, navigation tabs and buttons, and the finalized feature set was scaled and implemented across 13 different calculators.
Number entry
Calculation results
Introducing Responsiveness
The calculator was originally designed as a PC-only pop-up, making it difficult to use on mobile due to cramped layouts and horizontal scrolling. I redesigned it into a responsive, single-column layout optimized for vertical scrolling, improving mobile usability while maintaining cross-device consistency.

Designing Scalable Layouts to Localization
While Korean allows for more compact wording, enabling an effective two-column layout, English terms tend to be longer and require more space. To improve readability and visual balance in the English version, I adopted a stacked layout structure. This redesign reflects a scalable approach to localization — considering how language length and cultural context impact layout decisions across markets.

Impact
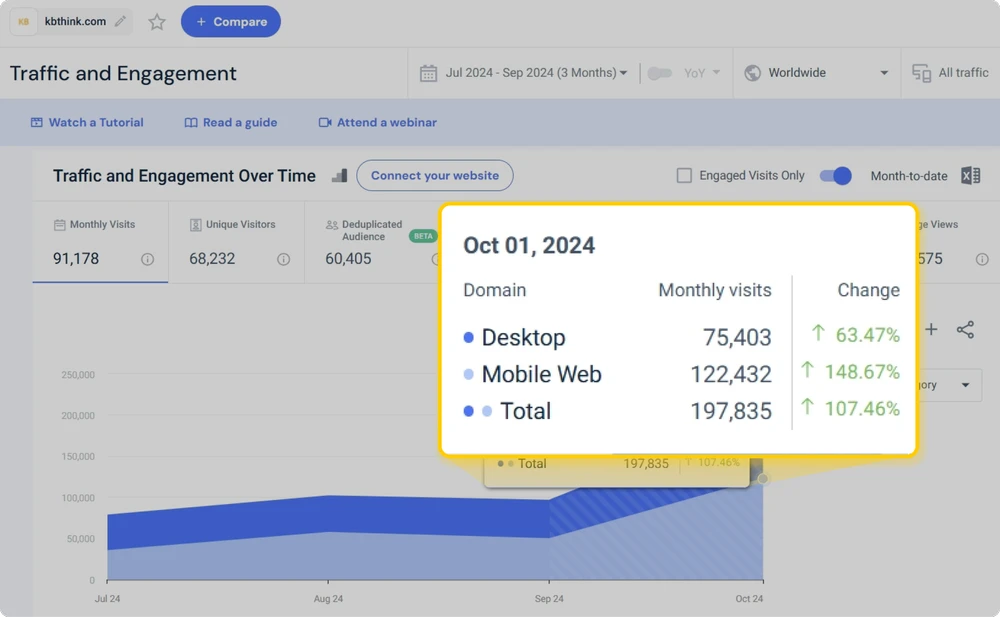
Calculator usage increased by over 38%, contributing to over 200,000 monthly users on KB Think.com.
User feedback highlighted its real-world impact:
“Thanks to this loan calculator, I was able to compare different scenarios based on my financial situation and confidently choose the best loan option.”
Overall, the redesigned experience delivered a more intuitive and empowering financial decision-making tool.
38%+
Growth rate of calculator users
200,000 Users+
Monthly users of KB Think.com
AI Opportunity
Evolving the Calculator
Beyond Static Workflows
Takeaways
Balancing essential vs. secondary features earlier have enabled us to ship main features sooner. We prioritized core UX problems and lower-priority features were strategically left into the backlog and scheduled for a second development phase to ensure focused and efficient delivery.
User feedback revealed that friction existed at both ends: (1) number entry and (2) calculation results. Understanding these dual pain points shaped the final design strategy and emphasized the value of holistic user research.
Through user research, I validated hypotheses and grounded the design decisions in real insights, ultimately increasing engagement and reducing cognitive load.


